用impala查询TSDB数据及用plot.ly来实现数据的可视化
背景
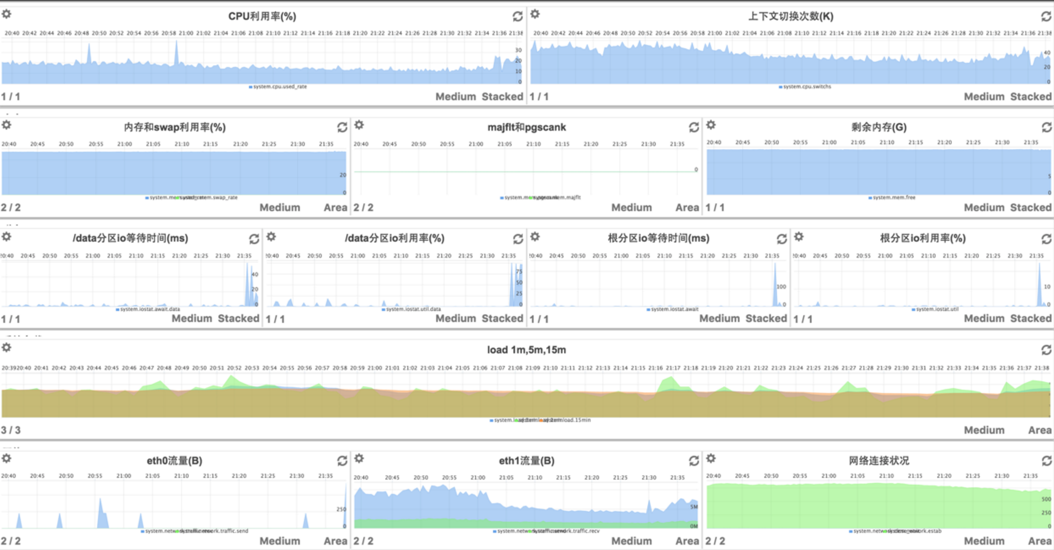
我们有个openTSDB集群,用来收集系统及应用的运维指标数据,以及分析性能问题,前端dashboard使用了metrilyx,metrilyx的优势在于可以灵活创建各种数据视图,如图,是将一台服务器的所有重要指标汇合在一个页面中:
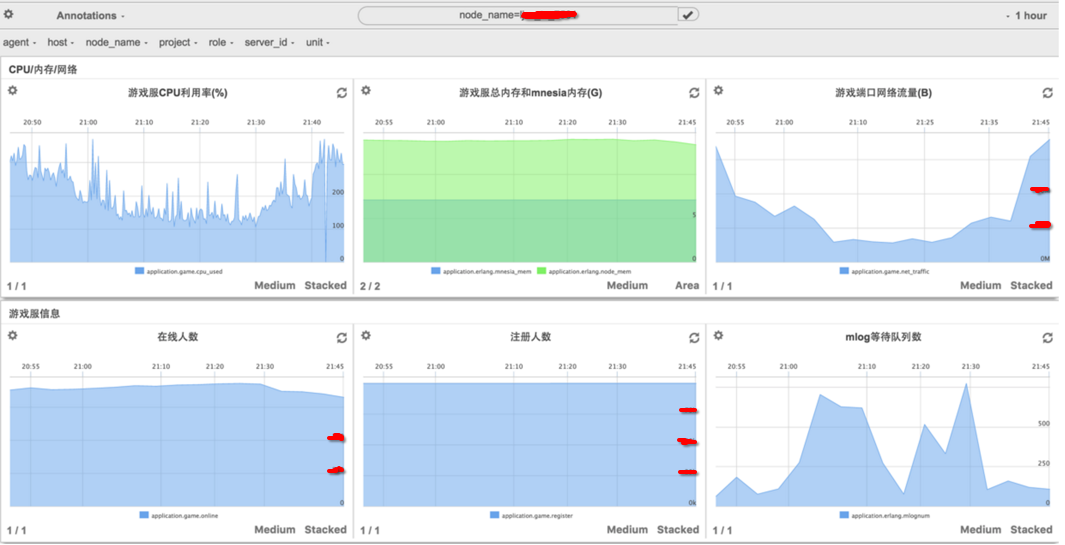
 另外,对于我们的游戏业务应用,用metrilyx创建聚合的页面可以清楚查看单独业务的应用,如下图:
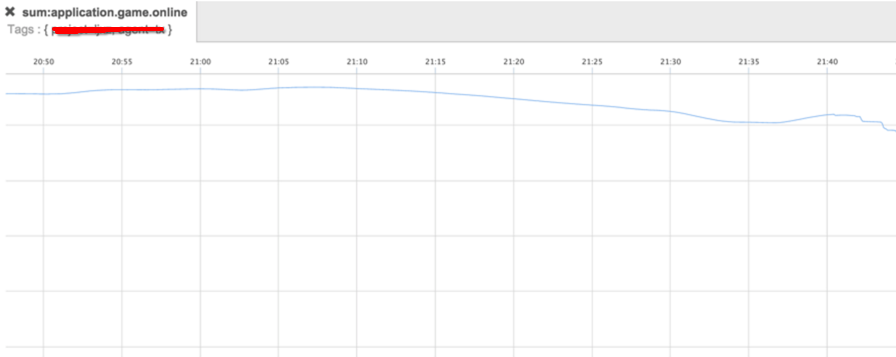
 也可以查询聚合数据,原理是将所有相同
tag的数据聚合起来,比如一个集群内所有的在线:
 这套系统(openTSDB+tcollector+metrilyx)基本上可以满足我们大部分对于性能指标监控的需求,但是却无法从集群角度上查询,例如:
- 在昨天,哪个游戏服(共300+个游戏服)哪个时间点的游戏进程CPU利用率最高?
- 在本月内,一天的哪个小时平均在线人数最高?
解决方法
- 将TSDB数据导入hadoop中,利用impala进行查询。由于目前貌似没有方法直接用impala从TSDB查询,暂时采用的是先将TSDB数据导出为文本,再导入hadoop的笨方法。
- 使用impala,上面的问题就可以用两个sql语句来解决了:
select server_id, max(value) from cpu_used where year=2015 and month=10 and day=28 group by server_id order by 2 desc limit 1;
select hour, avg(value) from online where year=2015 and month=10 group by hour order by 2 desc limit 1;
TSDB数据的导出
- TSDB query
query [Gnuplot opts] START-DATE [END-DATE] <aggregator> [rate] [counter,max,reset] [downsample N FUNC] <metric> [<tagk=tagv>] [...<tagk=tagv>] [...queries]
在实际使用中,我们的命令是这样的:
tsdb query "2015/10/08-00:00:00" "2015/10/08-23:59:59" sum application.game.cpu_used node_name="xxxx_yy_zzzz"
而输出的格式是:
application.game.cpu_used 1444317499000 20 {server_id=zzzz, unit=u_entry, project=xxxx, host=xxxx.yy.game.10.aa.bb.cc, role=gmain, node_name=xxxx_yy_zzzz, agent=yy}
- 文本处理
为了将数据导入hadoop,我们还需要做些额外的处理,我们需要处理为以下格式:
application.game.cpu_used 1444317590 2015 10 08 23 19 50 20 zzzz u_entry xxxx xxxx.yy.game.10.aa.bb.cc gmain xxxx_yy_zzzz yy
注意,分隔符是\t
祭出sed和awk大法:
tsdb query "2015/10/08-00:00:00" "2015/10/08-23:59:59" sum application.game.cpu_used node_name="xxxx_yy_zzzz" | sed -e 's/{//g' -e 's/}//g' -e 's/,//g' -e 's/ [^ ]\+=/ /g' | awk '{sub(/000$/,"", $2);date=strftime("%Y\t%m\t%d\t%H\t%M\t%S", $2);s=$1"\t"$2"\t"date"\t"$3"\t"$4;for(i=5;i<=NF;i++)s=s"\t"$i;print s}'
- 导出脚本
目前只收集以下5个指标值:
- application.game.cpu_used
- application.game.mem_used
- application.game.online
- application.game.register
- application.game.net_traffic
但是需要注意的是,application.game.net_traffic是收集游戏服与玩家之间的网络流量,因此是需要区分进出流量的,因此需要多输入一个tag:direction=recv或direction=send,最后编写一个shell脚本导出:
#!/bin/bash
#########################################
# 将一天的游戏服的TSDB数据dump为文本文件
# author: zhengheng 2015/09/14
#########################################

help () {
    echo "usage:   `basename $0` --day=day --metric=metric [--out=out]"
    echo "example: `basename $0` --day='2015/09/10' --metric='application.game.cpu_used' --out=/data/dump/out.txt"
}

ARGS=$(getopt -o a -l day:,metric:,out:: -- "$@")
if [ $? -ne 0 ]; then
    echo "Failed on getopt."
    help
    exit 1
fi
eval set -- "${ARGS}"
while true; do
    case "$1" in
        --day)
            day="$2"
            shift
            ;;
        --metric)
            metric="$2"
            shift
            ;;
        --out)
            outfile="$2"
            shift
            ;;
        --)
            shift
            break
            ;;
    esac
    shift
done

if [ -z "${day}" -o -z "${metric}" ]; then
    echo "Failed on options."
    help
    exit 2
fi

day=$(date -d "${day}" +"%Y/%m/%d")
if [ $? -ne 0 ]; then
    echo "failed on change date format to: YYYY/MM/DD"
    help
    exit 3
fi

if [ -z "${outfile}" ]; then
    mkdir -p /data/dump
    outfile=/data/dump/${metric}.$(date -d "${day} 00:00:00" +%s).txt
else
    mkdir -p $(dirname "${outfile}")
fi

sids=$(my_secret_api_to_get_server_list)

for sid in ${sids}; do
    node_name="xxxx_yy_${sid}"
    if [ "${metric}" != "application.game.net_traffic" ]; then
        tsdb query "${day}-00:00:00" "${day}-23:59:59" sum "${metric}" node_name="${node_name}" | \
        sed -e 's/{//g' -e 's/}//g' -e 's/,//g' -e 's/ [^ ]\+=/ /g' | \
        awk '{sub(/000$/,"", $2);date=strftime("%Y\t%m\t%d\t%H\t%M\t%S", $2);s=$1"\t"$2"\t"date"\t"$3"\t"$4;for(i=5;i<=NF;i++)s=s"\t"$i;print s}' >> "${outfile}"
    else
        tsdb query "${day}-00:00:00" "${day}-23:59:59" sum "${metric}" node_name="${node_name}" direction="recv" | \
        sed -e 's/{//g' -e 's/}//g' -e 's/,//g' -e 's/ [^ ]\+=/ /g' | \
        awk '{sub(/000$/,"", $2);date=strftime("%Y\t%m\t%d\t%H\t%M\t%S", $2);s=$1"\t"$2"\t"date"\t"$3"\t"$4;for(i=5;i<=NF;i++)s=s"\t"$i;print s}' >> "${outfile}"
        tsdb query "${day}-00:00:00" "${day}-23:59:59" sum "${metric}" node_name="${node_name}" direction="send" | \
        sed -e 's/{//g' -e 's/}//g' -e 's/,//g' -e 's/ [^ ]\+=/ /g' | \
        awk '{sub(/000$/,"", $2);date=strftime("%Y\t%m\t%d\t%H\t%M\t%S", $2);s=$1"\t"$2"\t"date"\t"$3"\t"$4;for(i=5;i<=NF;i++)s=s"\t"$i;print s}' >> "${outfile}"
    fi
    sleep 1
done
- 定时任务
接下来编写个脚本,用来做每天导出前一天数据的定时任务:
#!/bin/bash

if [ -z "$1" ]; then
    day=$(date -d "yesterday" "+%Y/%m/%d")
else
    day=$(date -d "${1}" "+%Y/%m/%d")
fi
metrics="application.game.cpu_used application.game.mem_used application.game.online application.game.register application.game.net_traffic"

cd /data/dump &&
/bin/rm -f *.tar.gz *.txt
for metric in ${metrics}; do
    /bin/bash /data/sh/dump/dump_xxxx_yy.sh --day="${day}" --metric="${metric}"
done
ts=$(date -d "${day}" +%s)
cd /data/dump &&
tar cvzf "xxxx.yy.game.metric.${ts}.tar.gz" *.txt
最后设置定时任务,TSDB服务端的事情就完成了:
30 5 * * * . /etc/profile; /bin/bash /data/sh/dump/daily_dump.sh >/dev/null 2>&1
注意: tsdb是个java应用,需要一些java方面的环境变量,否则会执行失败,因此在设置定时任务时,在命令前面添加了. /etc/profile
hive
用hive来创建表,并将文本文件导入表中。
- 创建表
首先创建一个不分区的表:
hive> create table tsdb_full (metric string, ts bigint, year int, month int, day int, hour int, minute int, second int, value float, server_id int, unit string, project string, host string, role string, node_name string, agent string) row format delimited fields terminated by '\t';
由于application.game.net_traffic多了一列,我们另外创建个表:
hive> create table tsdb_full_traffic (metric string, ts bigint, year int, month int, day int, hour int, minute int, second int, value float, server_id int, unit string, project string, host string, direction string, role string, node_name string, agent string) row format delimited fields terminated by '\t';
根据不同的指标值建立分区表:
hive> create table cpu_used (ts bigint, hour int, minute int, second int, value float, server_id int, unit string, project string, host string, role string, node_name string, agent string) partitioned by (year int, month int, day int) row format delimited fields terminated by '\t';
hive> create table mem_used (ts bigint, hour int, minute int, second int, value float, server_id int, unit string, project string, host string, role string, node_name string, agent string) partitioned by (year int, month int, day int) row format delimited fields terminated by '\t';
hive> create table online (ts bigint, hour int, minute int, second int, value float, server_id int, unit string, project string, host string, role string, node_name string, agent string) partitioned by (year int, month int, day int) row format delimited fields terminated by '\t';
hive> create table register (ts bigint, hour int, minute int, second int, value float, server_id int, unit string, project string, host string, role string, node_name string, agent string) partitioned by (year int, month int, day int) row format delimited fields terminated by '\t';
hive> create table traffic_recv (ts bigint, hour int, minute int, second int, value float, server_id int, unit string, project string, host string, role string, node_name string, agent string) partitioned by (year int, month int, day int) row format delimited fields terminated by '\t';
hive> create table traffic_send (ts bigint, hour int, minute int, second int, value float, server_id int, unit string, project string, host string, role string, node_name string, agent string) partitioned by (year int, month int, day int) row format delimited fields terminated by '\t';
用日期来分表,一方面是由于我们是一天导入一次数据,另一方面可以排除重复数据,因为TSDB导出时虽然指定了起始时间,但它同时还会导出起始时间前后两小时的数据
- 数据导入
用load data local inpath <your_file> overwrite into table <your_table>将本地文件导入,如:
hive> load data local inpath '/data/backup/application.game.cpu_used.1442246400.txt' overwrite into table tsdb_full;
- 插入分区表 用where语句导入符合条件的数据:
hive> insert into table cpu_used partition(year=2015, month=9, day=15) select ts, hour, minute, second, value, server_id, unit, project, host, role, node_name, agent from tsdb_full where metric='application.game.cpu_used' and year=2015 and month=9 and day=15;
同样,对于trafficrecv和trafficsend表需要另外处理:
hive> insert into table traffic_send partition(year=2015, month=9, day=15) select ts, hour, minute, second, value, server_id, unit, project, host, role, node_name, agent from tsdb_full_traffic where year=2015 and month=9 and day=15 and direction='send';
大概的导入过程就是这样,我们可以看下导入的结果:
# sudo -u hdfs hadoop fs -ls -h /user/hive/warehouse/cpu_used/year=2015/month=9/day=16
Found 1 items
-rwxrwxrwt   3 root supergroup    130.6 M 2015-09-21 23:16 /user/hive/warehouse/cpu_used/year=2015/month=9/day=16/000000_0
- 自动导入脚本
可以写个脚本自动导入了:
#!/bin/bash

if [ -z "$1" ]; then
    echo "`basename $0` [day]"
    exit 1
fi
DATE=$1
ts=$(date -d "${DATE}" +%s)
year=$(date -d "${DATE}" +%Y)
month=$(date -d "${DATE}" +%_m | sed -e 's/ //g')
day=$(date -d "${DATE}" +%_d | sed -e 's/ //g')

# TSDB服务端的IP我这里匿了
/usr/bin/scp xxx.xxx.xxx.xxx:/data/dump/*.tar.gz /data/backup/

if [ ! -e "/data/backup/xxxx.yy.game.metric.${ts}.tar.gz" ]; then
    echo "/data/backup/xxxx.yy.game.metric.${ts}.tar.gz not exist."
    exit 2
fi

cd /data/backup &&
/bin/rm -f *.txt &&
tar xvf /data/backup/xxxx.yy.game.metric.${ts}.tar.gz
if [ -e "/data/backup/application.game.cpu_used.${ts}.txt" -a -e "/data/backup/application.game.mem_used.${ts}.txt" -a -e "/data/backup/application.game.online.${ts}.txt" -a -e "/data/backup/application.game.register.${ts}.txt" -a -e "/data/backup/application.game.net_traffic.${ts}.txt" ]; then
    hive -e "load data local inpath '/data/backup/application.game.cpu_used.${ts}.txt' overwrite into table tsdb_full"
    hive -e "insert into table cpu_used partition(year=${year}, month=${month}, day=${day}) select ts, hour, minute, second, value, server_id, unit, project, host, role, node_name, agent from tsdb_full where year=${year} and month=${month} and day=${day}"
    hive -e "load data local inpath '/data/backup/application.game.mem_used.${ts}.txt' overwrite into table tsdb_full"
    hive -e "insert into table mem_used partition(year=${year}, month=${month}, day=${day}) select ts, hour, minute, second, value, server_id, unit, project, host, role, node_name, agent from tsdb_full where year=${year} and month=${month} and day=${day}"
    hive -e "load data local inpath '/data/backup/application.game.online.${ts}.txt' overwrite into table tsdb_full"
    hive -e "insert into table online partition(year=${year}, month=${month}, day=${day}) select ts, hour, minute, second, value, server_id, unit, project, host, role, node_name, agent from tsdb_full where year=${year} and month=${month} and day=${day}"
    hive -e "load data local inpath '/data/backup/application.game.register.${ts}.txt' overwrite into table tsdb_full"
    hive -e "insert into table register partition(year=${year}, month=${month}, day=${day}) select ts, hour, minute, second, value, server_id, unit, project, host, role, node_name, agent from tsdb_full where year=${year} and month=${month} and day=${day}"
    hive -e "load data local inpath '/data/backup/application.game.net_traffic.${ts}.txt' overwrite into table tsdb_full_traffic"
    hive -e "insert into table traffic_send partition(year=${year}, month=${month}, day=${day}) select ts, hour, minute, second, value, server_id, unit, project, host, role, node_name, agent from tsdb_full_traffic where year=${year} and month=${month} and day=${day} and direction='send'"
    hive -e "insert into table traffic_recv partition(year=${year}, month=${month}, day=${day}) select ts, hour, minute, second, value, server_id, unit, project, host, role, node_name, agent from tsdb_full_traffic where year=${year} and month=${month} and day=${day} and direction='recv'"
fi
- 定时任务
00 8 * * * . /etc/profile; /bin/bash /data/impala/import_hive.sh $(date -d "1 day ago" "+\%Y/\%m/\%d") >/dev/null 2>&1
需要注意的是,crontab里百分号%是有特殊含义的,需要转义。
impala
在hive里导入的数据,impala是无法自动更新的,需要执行一个指令:
[hd2.mc.com:21000] > invalidate metadata;
Query: invalidate metadata

Returned 0 row(s) in 1.01s
这条指令的作用是令impala的元数据无效,让其重新获取,这样就相当于更新了数据。
好了,数据有了,现在我们试下查询了:
[hd2.mc.com:21000] > select node_name, max(value) from cpu_used where year=2015 and month=9 and day=16 group by node_name order by 2 desc limit 2;
Query: select node_name, max(value) from cpu_used where year=2015 and month=9 and day=16 group by node_name order by 2 desc limit 2
+--------------+------------+
| node_name    | max(value) |
+--------------+------------+
| xxxx_yy_zzzz | 1139       |
| xxxx_yy_aaaa | 1136       |
+--------------+------------+
Returned 2 row(s) in 0.51s
impyla
接下来我们用impala python api来编写impyla脚本自动更新metadata:
#!/usr/local/bin/python
#-*- coding:utf8 -*-

from impala.dbapi import connect
conn = connect(host='hd2.mc.com', port=21050)
cursor = conn.cursor()
cursor.execute('invalidate metadata')
设置定时任务
00 9 * * * /usr/local/bin/python /data/impala/invalidate.py >/dev/null 2>&1
这样就完成了数据导出导入的所有操作了,接下来可以关注于数据分析了。
plotly
一般来说,分析生成图表,貌似需要弄个web应用,这里先用一个颜值高的可以通过api来绘图的在线应用:plotly
首先免费注册一个账号,然后安装plotly:
pip install plotly
然后初始化:
python -c "import plotly; plotly.tools.set_credentials_file(username='this_is_my_name', api_key='this_is_a_key')"
测试下:
#!/usr/local/bin/python
#-*- coding:utf8 -*-

from impala.dbapi import connect
import plotly.plotly as py
from plotly.graph_objs import *

conn = connect(host='hd2.mc.com', port=21050)
cursor = conn.cursor()
cursor.execute('select hour, avg(value) from online group by hour')
results = cursor.fetchall()

x = [str(i[0]) for i in results]
y = [i[1] for i in results]

trace0 = Bar(
    x=x,
    y=y,
    marker=Marker(color='#E3BA22')
)
data = Data([trace0])
py.plot(data)
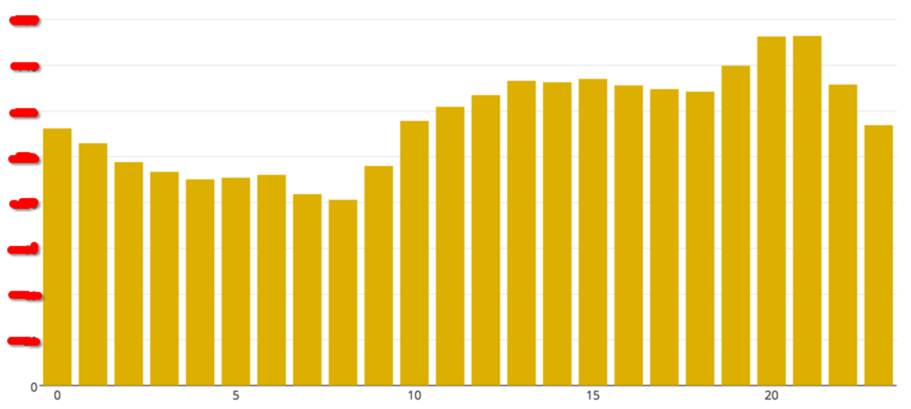
执行上面的脚本,获取了以小时分组排序的游戏服在线数据。为了保密,匿掉了数值。从图中可以看到,晚上8到9点之间的平均在线人数最高。
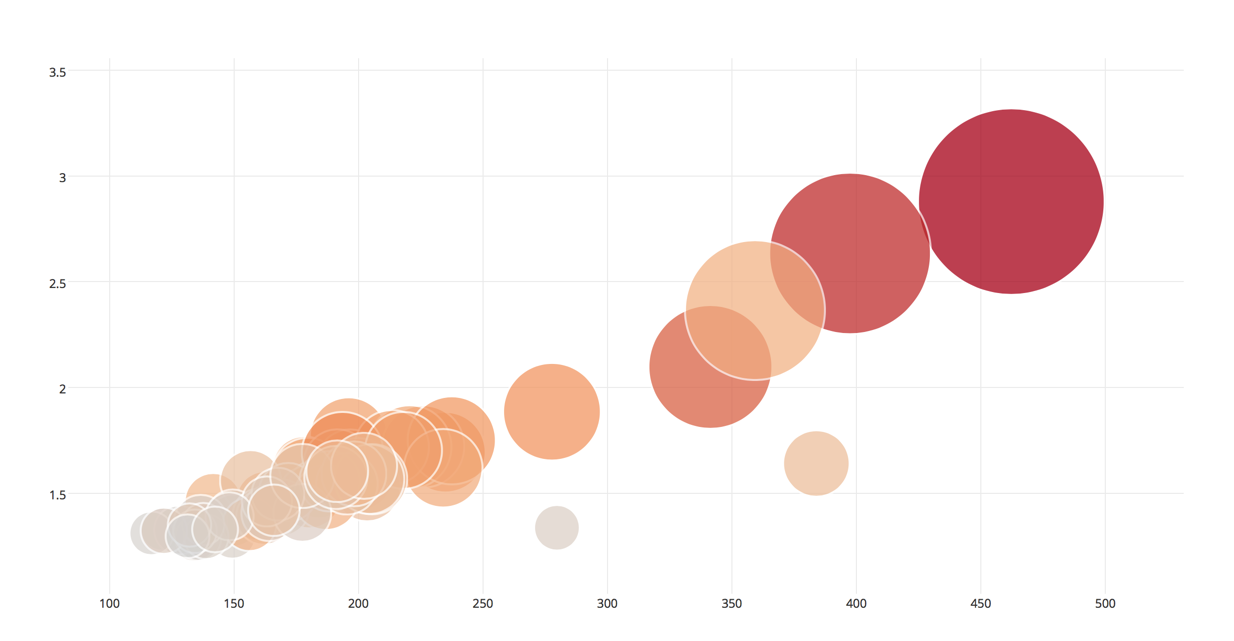
下面这个泡泡图,展示了一个游戏服开服6小时内的数据表现,颜色深浅代表注册人数的多少,泡泡的大小代表平均在线,x轴是平均CPU利用率,而y轴是平均内存
 代码如下:
代码如下:
#-*- coding:utf8 -*-

import sys
from myImpalaApi import impalaClient
from datetime import datetime, timedelta
from time import strptime, mktime, sleep
import plotly.plotly as py
from plotly.graph_objs import *

start_date = sys.argv[1]
end_date   = sys.argv[2]
start_dt = datetime.fromtimestamp(mktime(strptime(start_date, "%Y-%m-%d")))
end_dt   = datetime.fromtimestamp(mktime(strptime(end_date,   "%Y-%m-%d")))
delta_days = (end_dt - start_dt).days

openday_data = []
for days in range(delta_days):
    year, month, day = [int(i) for i in (start_dt + timedelta(days=days)).strftime("%Y-%m-%d").split("-")]
    cli = impalaClient("hd2.mc.com")
    # TODO: need a better method to get new server list
    new_servs = cli.query("select server_id from (select max(value) as max_value, min(value) as min_value, server_id from register where year=%d and month=%d and day=%d and server_id<5000 group by server_id) t where max_value>10 and min_value=0 order by server_id" % (year, month, day))
    new_servs = [int(i[0]) for i in new_servs]
    for serv in new_servs:
        cnt = cli.query("select count(1) from register where year=%d and month=%d and day=%d and server_id=%d and value=0" % (year, month, day, serv))[0][0]
        if int(cnt) < 100:
            continue
        else:
            opentime   = cli.query("select ts from online where year=%d and month=%d and day=%d and server_id=%d and value>5" % (year, month, day, serv))[0][0]
            opentime_e = opentime + 60 * 60 * 6
            avg_online = cli.query("select avg(value) from online   where year=%d and month=%d and day=%d and server_id=%d and ts between %d and %d" % (year, month, day, serv, opentime, opentime_e))[0][0]
            max_online = cli.query("select max(value) from online   where year=%d and month=%d and day=%d and server_id=%d and ts between %d and %d" % (year, month, day, serv, opentime, opentime_e))[0][0]
            avg_cpu    = cli.query("select avg(value) from cpu_used where year=%d and month=%d and day=%d and server_id=%d and ts between %d and %d" % (year, month, day, serv, opentime, opentime_e))[0][0]
            max_cpu    = cli.query("select max(value) from cpu_used where year=%d and month=%d and day=%d and server_id=%d and ts between %d and %d" % (year, month, day, serv, opentime, opentime_e))[0][0]
            avg_mem    = cli.query("select avg(value) from mem_used where year=%d and month=%d and day=%d and server_id=%d and ts between %d and %d" % (year, month, day, serv, opentime, opentime_e))[0][0]
            max_mem    = cli.query("select max(value) from mem_used where year=%d and month=%d and day=%d and server_id=%d and ts between %d and %d" % (year, month, day, serv, opentime, opentime_e))[0][0]
            register   = cli.query("select max(value) from register where year=%d and month=%d and day=%d and server_id=%d and ts between %d and %d" % (year, month, day, serv, opentime, opentime_e))[0][0]
            openday_data.append([str(serv), avg_online, max_online, avg_cpu, max_cpu, avg_mem, max_mem, register])

servs       = [x[0] for x in openday_data]
avg_onlines = [x[1] for x in openday_data]
max_onlines = [x[2] for x in openday_data]
avg_cpus    = [x[3] for x in openday_data]
max_cpus    = [x[4] for x in openday_data]
avg_mems    = [x[5] for x in openday_data]
max_mems    = [x[6] for x in openday_data]
registers   = [x[7] for x in openday_data]

data = [
    {
        'x': avg_cpus,
        'y': avg_mems,
        'text': servs,
        'mode': 'markers',
        'marker': {'symbol': 'circle', 'sizemode': 'diameter', 'sizeref': 0.85, 'color': [i/200 for i in registers], 'size': [j/10 for j in avg_onlines], 'line': {'width': 2}}
    }
]
layout = {'width': 600, 'height': 600}
fig = {'data': data, 'layout': layout}
py.plot(fig)