项目中需要根据端口来收集流量,如一台服务器上有3个不同的服务,需要分别监控各个服务的进出流量。
新版本的iftop提供了文本模式的选项,适合用来做文本处理然后做统计。
iftop: display bandwidth usage on an interface by host

Synopsis: iftop -h | [-npblNBP] [-i interface] [-f filter code]
                               [-F net/mask] [-G net6/mask6]

   -h                  display this message
   -n                  don't do hostname lookups
   -N                  don't convert port numbers to services
   -p                  run in promiscuous mode (show traffic between other
                       hosts on the same network segment)
   -b                  don't display a bar graph of traffic
   -B                  Display bandwidth in bytes
   -i interface        listen on named interface
   -f filter code      use filter code to select packets to count
                       (default: none, but only IP packets are counted)
   -F net/mask         show traffic flows in/out of IPv4 network
   -G net6/mask6       show traffic flows in/out of IPv6 network
   -l                  display and count link-local IPv6 traffic (default: off)
   -P                  show ports as well as hosts
   -m limit            sets the upper limit for the bandwidth scale
   -c config file      specifies an alternative configuration file
   -t                  use text interface without ncurses

   Sorting orders:
   -o 2s                Sort by first column (2s traffic average)
   -o 10s               Sort by second column (10s traffic average) [default]
   -o 40s               Sort by third column (40s traffic average)
   -o source            Sort by source address
   -o destination       Sort by destination address

   The following options are only available in combination with -t
   -s num              print one single text output afer num seconds, then quit
   -L num              number of lines to print

iftop, version 1.0pre4
copyright (c) 2002 Paul Warren <pdw@ex-parrot.com> and contributors
安装
依赖libpcap
- 包管理工具安装
- 源码编译
输出模式
先使用文本模式看下iftop的输出:
# /usr/local/sbin/iftop -i any -s 10 -t -N -P -B -L 10000
interface: any
Error getting hardware address for interface: any
ioctl(SIOCGIFHWADDR): No such device
Unable to get IP address for interface: any
ioctl(SIOCGIFADDR): No such device
Listening on any
   # Host name (port/service if enabled)            last 2s   last 10s   last 40s cumulative
   1 10.204.xxx.xxx:41499                     =>     3.86KB     6.11KB     6.11KB     61.1KB
     10.221.xx.xx:32924                       <=     11.9KB     14.5KB     14.5KB      145KB
   2 10.204.xxx.xxx:443                       =>     1.47KB     6.67KB     6.67KB     66.7KB
     223.245.xxx.xx:1172                      <=       568B       569B       569B     5.55KB
  省略...
  --------------------------------------------------------------------------------------------
Total send rate:                                      376KB      378KB      378KB
Total receive rate:                                   130KB      126KB      126KB
Total send and receive rate:                          506KB      505KB      505KB
--------------------------------------------------------------------------------------------
Peak rate (sent/received/total):                      452KB      135KB      586KB
Cumulative (sent/received/total):                    3.69MB     1.23MB     4.93MB
============================================================================================
上面的指令是统计了10秒内(-s 10)所有网络设备(-i any)的流量情况,并打印端口(-P),=>是出流量,<=是进流量。使用sed和awk再将需要统计的端口过滤及统计出来。
编写统计脚本
#!/bin/bash

while :
do
        ifdata=$(/usr/local/sbin/iftop -i any -s 10 -t -N -P -B -L 10000 2>/dev/null)
        for game in `ls -d /data/xxxx_*_*`
        do
                CONFIG="${game}/config"
                server_id=$(echo ${game} | awk -F_ '{print $NF}')
                node_name=$(echo ${game} | awk -F/ '{print $NF}')
                GW=$(awk -F'[,}{]' '/port/{gsub(/\s*/,"",$0);print $3}' ${CONFIG})
                ret=$(echo "${ifdata}" | sed -n "/:${GW}/{p;n;p}")
                send=$(awk '{if($0~/=>/){if($NF~/KB/){sub(/KB/,"",$NF);sum+=$NF*1024}else{sub(/B/,"",$NF);sum+=$NF}}}END{printf("%d",sum/10)}' <<< "${ret}")
                recv=$(awk '{if($0~/<=/){if($NF~/KB/){sub(/KB/,"",$NF);sum+=$NF*1024}else{sub(/B/,"",$NF);sum+=$NF}}}END{printf("%d",sum/10)}' <<< "${ret}")
                echo "application.game.net_traffic `date +%s` ${recv} direction=recv unit=u_B/s server_id=${server_id} node_name=${node_name}"
                echo "application.game.net_traffic `date +%s` ${send} direction=send unit=u_B/s server_id=${server_id} node_name=${node_name}"
        done
        sleep 60
done
执行上面的脚本输出如下:
application.game.net_traffic 1423722667 4463 direction=recv unit=u_B/s server_id=xxxx node_name=xxxx_xx_xxxx
application.game.net_traffic 1423722667 11470 direction=send unit=u_B/s server_id=xxxx node_name=xxxx_xx_xxxx
application.game.net_traffic 1423722667 94787 direction=recv unit=u_B/s server_id=yyyy node_name=yyyy_yy_yyyy
application.game.net_traffic 1423722667 350172 direction=send unit=u_B/s server_id=yyyy node_name=yyyy_yy_yyyy
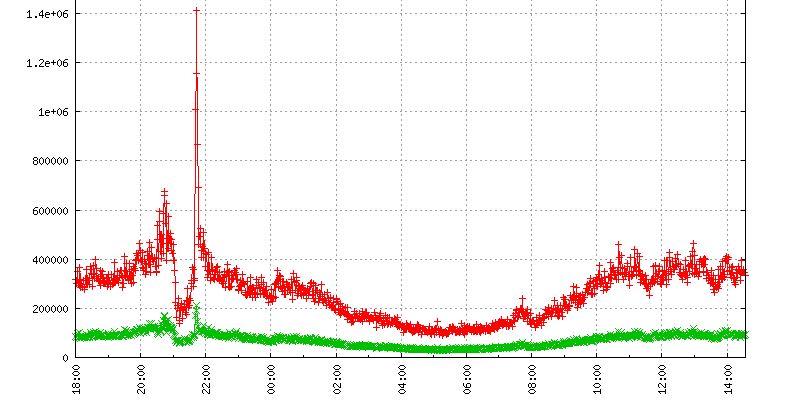
接着就可以部署在tsdb上进行监控了: