常用内置函数
printf()
与C语言中的printf一样,不同点在于:systemtap的printf只有长整型和字符串两种类型输出,因此小数需要如下面这样处理:
printf("%16s %5d %3d.%02d%% %3d.%02d%%\n", e, tid, uscaled/100, uscaled%100, kscaled/100, kscaled%100) // %%表示转义%
sprintf()
与printf类似,不过不打印到stdout,用来赋值给字符串变量,如
argstr = sprintf("%p, %p", $file, $vma)
tid()
当前线程(thread)的id
pid()
当前线程的进程id
uid()
user id
execname()
进程名
cpu()
线程所使用的cpu序号
gettimeofday_s()
当前时间的时间戳,同样的还有gettimeofday_ms(),gettimeofday_us()等
pp()
probe point,描述当前监测点的字符串
probefunc()
探测器到达的函数名
aggregates
用于读取统计变量(statistics)的一系列统计函数
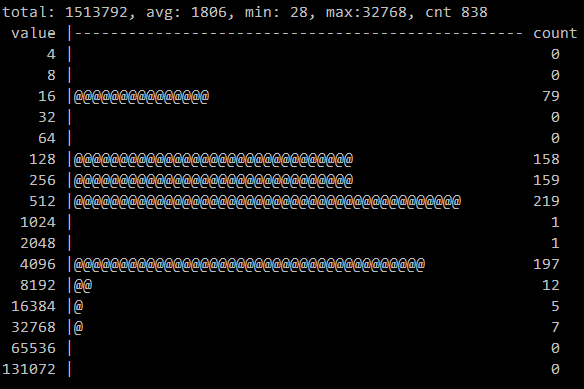
@min 返回statistics中的元素的最小值@max 返回statistics中的元素的最大值@count 返回statistics中的元素的个数@avg 返回statistics中的元素的平均值@sum 返回statistics中的元素的总和@hist_log 用@来图形化打印statistics
global total_bytes_to_read
function print_out()
{
        sum_bytes_to_read = @sum(total_bytes_to_read)
        avg_bytes_to_read = @avg(total_bytes_to_read)
        min_bytes_to_read = @min(total_bytes_to_read)
        max_bytes_to_read = @max(total_bytes_to_read)
        cnt_bytes_to_read = @count(total_bytes_to_read)
        printf("total: %ld, avg: %ld, min: %ld, max:%ld, cnt %ld\n", sum_bytes_to_read, avg_bytes_to_read, min_bytes_to_read, max_bytes_to_read, cnt_bytes_to
_read)
        print(@hist_log(total_bytes_to_read))
        delete total_bytes_to_read
}
probe vfs.read
{
        if(bytes_to_read > 0 && devname != "N/A")
                total_bytes_to_read <<< bytes_to_read
}
probe timer.s(5)
{
        print_out()
}
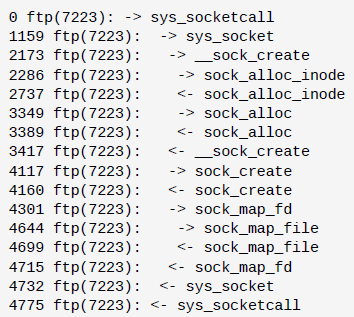
thread_indent()
线程缩进打印,可以用来展示一个线程调用内核函数的先后顺序,输出结果:第一列是调用时间(单位ms),第二列是线程名及tid,第三列是以空格缩进来表示的调用事件。举例:
probe kernel.function("*@net/socket.c").call
{
    printf ("%s -> %s\n", thread_indent(1), probefunc())
}
probe kernel.function("*@net/socket.c").return
{
    printf ("%s <- %s\n", thread_indent(-1), probefunc())
}